

California has the highest number of electric vehicles in the United States on a state-by-state basis, new research has shown, with 2,315.23 registered vehicles per 100,000 of population.
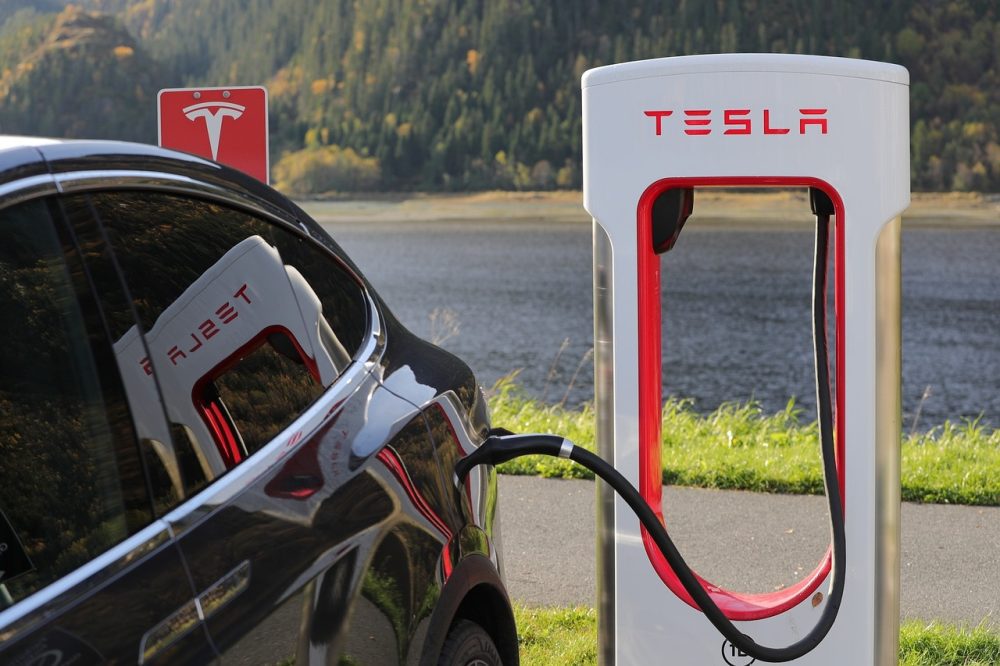
California’s commitment to sustainable transportation is illustrated by the fact that the state boasts the most extensive charging infrastructure, charging infrastructure, having over four times more public charging points than any other in the US: 43,781 to be precise.
Hawaii ranks second, according to the research, with 1,372.03 electric vehicles per 100,000 of population, with Washington in third, with 1,336.4 EVs per 100,000.
The research involved an analysis of data from the US Department of Energy, which provided information on the number of registered electric vehicles (EVs) in each state. These figures were then adjusted based on the population of each region to establish the ranking.
Best of the rest
Oregon ranks fourth with 1,107.98 per 100,000, and Nevada fifth with 1,036.88. Colorado follows closely with 1,025.86, while New Jersey takes the seventh spot with 939.67. Arizona is eighth with 893.84, Utah ninth with 829.68, and Vermont rounds out the top ten with 812.9 electric vehicles per 100,000 residents.
At the other end of the list, North Dakota boasts just 82.12 electric vehicles per 100,000 people – with just 640 EVs registered in the state, despite a tax credit incentive for purchasing said vehicles.
What US state has the highest number of electric vehicles
| State | Population | Registered EVs per 100k |
|---|---|---|
| California | 39,029,342 | 2315.23 |
| Hawaii | 1,440,196 | 1372.03 |
| Washington | 7,785,786 | 1336.40 |
| Oregon | 4,240,137 | 1107.98 |
| Nevada | 3,177,772 | 1036.88 |
| Colorado | 5,839,926 | 1025.86 |
| New Jersey | 9,261,699 | 939.67 |
| Arizona | 7,359,197 | 893.84 |
| Utah | 3,380,800 | 829.68 |
| Vermont | 647,064 | 812.90 |
| Florida | 22,244,823 | 755.18 |
| Maryland | 6,164,660 | 747.16 |
| Massachusetts | 6,981,974 | 708.10 |
| Virginia | 8,683,619 | 651.91 |
| Connecticut | 3,626,205 | 607.52 |
| Georgia | 10,912,876 | 550.90 |
| Illinois | 12,582,032 | 531.55 |
| Delaware | 1,018,396 | 529.26 |
| New Hampshire | 1,395,231 | 500.99 |
| Texas | 30,029,572 | 496.17 |
| New York | 19,677,151 | 430.29 |
| North Carolina | 10,698,973 | 426.11 |
| Minnesota | 5,717,184 | 425.55 |
| Oklahoma | 4,019,800 | 405.24 |
| Rhode Island | 1,093,734 | 396.80 |
| Pennsylvania | 12,972,008 | 365.71 |
| Maine | 1,385,340 | 360.20 |
| New Mexico | 2,113,344 | 335.01 |
| Michigan | 10,034,113 | 330.37 |
| Tennessee | 7,051,339 | 312.56 |
| Idaho | 1,939,033 | 306.33 |
| Montana | 1,122,867 | 290.32 |
| Ohio | 11,756,058 | 289.72 |
| Missouri | 6,177,957 | 289.25 |
| Alaska | 733,583 | 268.54 |
| Wisconsin | 5,892,539 | 266.43 |
| Indiana | 6,833,037 | 259.18 |
| Kansas | 2,937,150 | 257.05 |
| South Carolina | 5,282,634 | 255.36 |
| Nebraska | 1,967,923 | 232.22 |
| Iowa | 3,200,517 | 194.34 |
| Alabama | 5,074,296 | 172.04 |
| Arkansas | 3,045,637 | 168.76 |
| Kentucky | 4,512,310 | 167.54 |
| Wyoming | 581,381 | 144.48 |
| South Dakota | 909,824 | 128.59 |
| Louisiana | 4,590,241 | 128.09 |
| West Virginia | 1,775,156 | 105.34 |
| Mississippi | 2,940,057 | 82.31 |
| North Dakota | 779,261 | 82.12 |
Looking to navigate the unpredictability of climate change? Read www.sustainabilityonline.net to keep up to date.