Renewable sources accounted for 54.1% of the total electricity generated in the European Union in the second quarter of 2026, according to new data from Eurostat.
This was a slight decline on the 54.3% recorded in the second quarter of 2025, the data showed, with notable differences evident across EU member states.
Solar leads the way
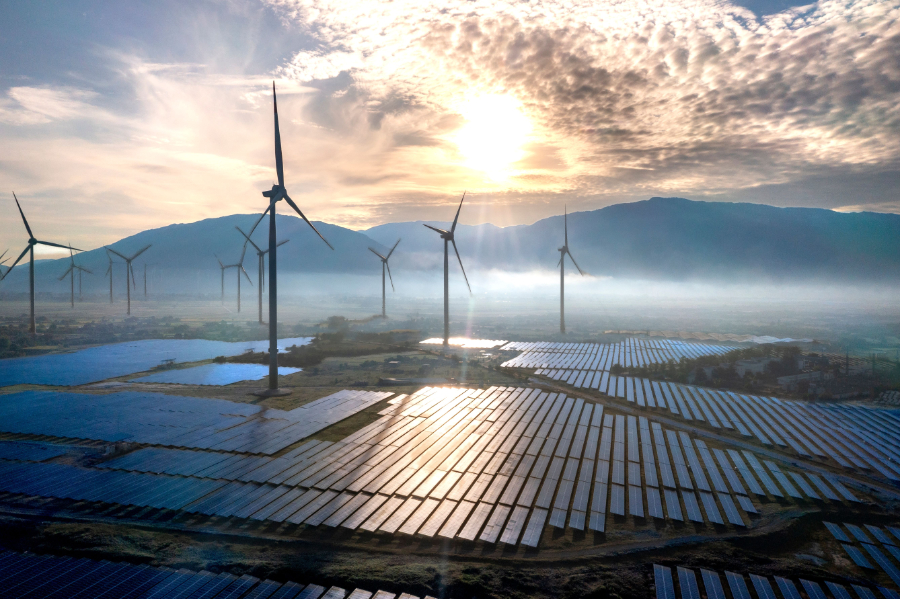
Solar was the leading source of renewable electricity in the EU in the second quarter of this year, accounting for 41.6% of generation, a 4.6-percentage-point increase on the 37.0% recorded in the second quarter of 2025.
Wind accounted for 27.7% of renewable electricity generation, followed by hydropower, which accounted for 22.6%. Combustible renewable fuels accounted for 7.7%, while geothermal and other renewable sources accounted for 0.4%.

Country by country
On a country-by-country basis, Latvia reported the highest share of electricity produced from renewable sources in the quarter (97.7%), with hydropower and solar providing most of its renewable generation.
Denmark followed in second place (94.3%), with its renewable electricity largely generated by wind, while Croatia (92.2%), mostly relied on hydropower.
At the other end of the scale, Slovakia recorded a renewable share of just 19.8%, followed by Czechia (20.9%) and Malta (24.5%). Read more here.
Net Electricity Generation from Renewables and Biofuels (GWh)
| Country | Apr-26 | May-26 | Jun-26 |
|---|---|---|---|
| Belgium | 2,628.712 | 2,427.169 | 2,675.844 |
| Bulgaria | 1,248.135 | 1,509.470 | 1,564.751 |
| Czechia | 1,190.108 | 1,223.259 | 1,152.049 |
| Denmark | 2,579.631 | 2,378.305 | 2,190.016 |
| Germany | 23,706.715 | 22,413.935 | 23,556.969 |
| Estonia | 379.476 | 362.337 | 292.045 |
| Ireland | 1,449.616 | 1,145.483 | 1,205.357 |
| Greece | 1,798.966 | 2,115.347 | 2,328.337 |
| Spain | 12,336.076 | 13,370.876 | 14,306.373 |
| France | 13,659.999 | 14,078.121 | 12,859.780 |
| Croatia | 927.092 | 880.440 | 762.008 |
| Italy | 12,030.000 | 13,284.000 | 13,551.000 |
| Cyprus | 142.401 | 153.059 | 184.508 |
| Latvia | 712.000 | 529.000 | 483.000 |
| Lithuania | 658.845 | 569.220 | 400.625 |
| Luxembourg | 123.891 | 124.408 | 133.932 |
| Hungary | 1,513.179 | 1,663.680 | 1,653.321 |
| Malta | 39.459 | 42.616 | 43.287 |
| Netherlands | 5,860.944 | 6,064.896 | 6,519.965 |
| Austria | 5,153.287 | 5,631.891 | 6,121.782 |
| Poland | 5,556.090 | 5,390.377 | 5,111.957 |
| Portugal | 3,353.433 | 3,539.140 | 3,253.450 |
| Romania | 2,438.000 | 2,635.000 | 2,295.000 |
| Slovenia | 373.476 | 508.930 | 592.336 |
| Slovakia | 432.000 | 400.000 | 424.000 |
| Finland | 3,576.000 | 3,505.000 | 3,154.000 |
| Sweden | 10,458.507 | 9,405.194 | 8,337.570 |