Some 45.5% of the electricity generated in the European Union came from renewable sources in the first quarter of this year, according to new data from Eurostat.
This is up from 42.7% in the corresponding period a year earlier, the data showed.
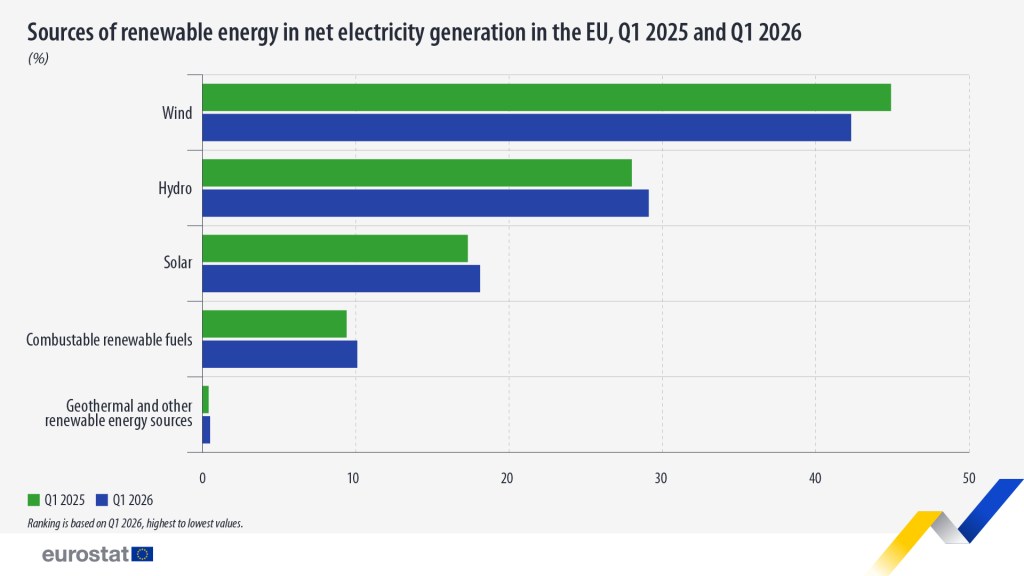
Wind was the primary source of renewable electricity in the EU in the first quarter, contributing 44.9% of total renewable generation, up from 42.3% in the same period last year.
This was followed by hydropower (28.0%) and solar energy (17.3%), while renewable combustible fuels accounted for 9.4%, and geothermal and other renewable sources made up the remaining 0.4%.
Denmark leads the way
On a country-by-country basis, Denmark boasted the highest share of renewable electricity generation in the period, at 90%, mainly driven by wind power. Portugal, with 82.9%, ranked second, with its electricity largely powered by hydro, while Lithuania (75.7%) also dominated by wind generation, ranked third.
At the other end of the scale, Czechia generated just 12.7% of its electricity from renewable sources, followed by Malta (13.0%) and Slovakia (17.2%).
‘The use of renewable energy has many potential benefits, including a reduction in greenhouse gas emissions, the diversification of energy supplies and a reduced dependency on fossil fuel markets (in particular, oil and gas),’ Eurostat noted. ‘The growth of renewable energy sources may also stimulate employment in the EU, through the creation of jobs in new ‘green’ technologies, which will be one of the cornerstones of the Energy Union and the Clean Industrial Deal.’
According to Eurostat, these figures relate to the share of renewable energy in electricity generation and should not be confused with the Renewable Energy Directive’s (RED) indicator, which measures the share of renewables in gross electricity consumption using a different methodology. Read more here.
Net Electricity Generation from Renewables and Biofuels by EU Member State (GWh)
| Country | January 2026 (GWh) | February 2026 (GWh) | March 2026 (GWh) |
|---|---|---|---|
| Belgium | 1,933.483 | 2,162.758 | 2,521.104 |
| Bulgaria | 1,021.966 | 1,076.737 | 1,254.700 |
| Czechia | 711.052 | 750.715 | 1,111.517 |
| Denmark | 3,522.599 | 3,090.355 | 2,876.584 |
| Germany | 21,228.789 | 20,312.524 | 22,715.467 |
| Estonia | 245.243 | 294.975 | 373.544 |
| Ireland | 1,382.140 | 1,520.560 | 1,613.476 |
| Greece | 2,931.063 | 2,723.271 | 2,560.026 |
| Spain | 14,294.643 | 13,859.503 | 14,735.685 |
| France | 13,872.779 | 15,144.371 | 15,753.729 |
| Croatia | 1,197.071 | 1,259.577 | 1,043.037 |
| Italy | 8,994.000 | 9,649.000 | 11,513.000 |
| Cyprus | 102.449 | 98.706 | 115.700 |
| Latvia | 235.000 | 211.000 | 697.000 |
| Lithuania | 691.358 | 546.424 | 588.455 |
| Luxembourg | 74.082 | 106.034 | 102.306 |
| Hungary | 440.514 | 683.113 | 1,224.671 |
| Malta | 16.379 | 23.848 | 28.181 |
| Netherlands | 4,866.531 | 4,960.401 | 5,643.704 |
| Austria | 3,833.327 | 3,836.283 | 4,966.573 |
| Poland | 3,761.668 | 3,550.299 | 5,596.806 |
| Portugal | 4,906.937 | 4,435.216 | 4,313.838 |
| Romania | 1,984.000 | 2,185.000 | 2,345.000 |
| Slovenia | 278.279 | 369.905 | 411.050 |
| Slovakia | 358.000 | 487.000 | 472.000 |
| Finland | 4,401.000 | 3,829.000 | 4,829.000 |
| Sweden | 12,871.231 | 11,492.302 | 11,894.291 |